
Email delay troubleshooting
Networkpacket-capturetroubleshooting
Quick note from a production troubleshooting session that ate a few hours before the root cause finally clicked. Users started seeing occasional email delays the day after a network change. We went through the change log and configs more times than I’d like to admit — nothing obvious. What finally told the story was packet captures from multiple segments:
TLS was failing between the local SMTP server and the external service during the certificate exchange.
Symptom
- Partial user reports of email delay around ~20 minutes
Topology
 Internet
    |
    v
+----------------------+
| 48.218.xx.xx         |
| External SMTP server |
+----------------------+
    |
    v
+----------+
|  Akamai  |
+----------+
    |
    |  *** Capture point 1 ***
    v
+-------------+
| WAN Router  |
+-------------+
    |
    v
+------+
|  FW  |
+------+
    |
    v
+--------------+
| Leaf Switch  |
+--------------+
    |
    |  *** Capture point 2 ***
    v
+--------+
|  LTM   |
+--------+
    |
    v
+-------------------+
| 10.x.x.x          |
| Local SMTP server |
+-------------------+
Root Cause
Certificate-exchange packets were getting lost on the inbound path from Akamai toward the WAN router.
Why that mattered: Akamai is picky about packet size on GRE-style paths — they expect MSS ≤ 1436 on edge routers (and even lower for VPN concentrators). Oversized segments with DF set don’t fragment; they just disappear.
Why the impact was only partial: some inbound traffic did not go through Akamai.
How I found out
- Checked FW / routing / LTM config and logs — nothing that screamed “this is it.”
- App team pointed us at the exact SMTP server that was delaying.
- Captured at the same time on server egress, WAN, and internal segments.
- Narrowed the failure to the TLS certificate exchange phase.
- Compared a delayed session vs a healthy one:
- Good session: retransmit allowed IP fragmentation (
DF = 0). - Bad session: DF stayed set (
DF = 1), so oversized packets could not fragment. - Good session TCP MSS peaked around 1318; bad session around 1200. The smoking gun was not “MSS too high vs Akamai’s 1436 ceiling,” but DF + silent drop — the bad path never recovered cleanly even with a smaller MSS.
- Good session: retransmit allowed IP fragmentation (
- Used TCP sequence numbers to pin down exactly which packets were dropped. See 3. How cumulative ACK and SACK reveal the gap.
- Checked Akamai logs — they had the packet-drop record.
- Temporary fix: clamp MSS to 1360 or lower on the affected path.
- Service test looked good after that.
Tech note
A few things worth knowing if you’re the networking person on a case like this.
1. Use raw TCP sequence numbers in Wireshark
Wireshark shows relative seq/ack by default (first segment of the conversation becomes 0). That’s nice for reading, but when you compare captures across boxes — or feed numbers into a script — you want the real values from the header.
- Preference: Edit → Preferences → Protocols → TCP → untick Relative sequence numbers
- Or keep relative display on and filter/compare with
tcp.seq_raw/tcp.ack_raw
Official write-up: Wireshark Wiki — TCP Relative Sequence Numbers
2. How SMTP STARTTLS actually sets up the session
I wasn’t sure at first whether I’d only see encrypted blobs instead of useful protocol state. In practice the server uses STARTTLS: encryption rides on top of a normal TCP session on port 25, so classic TCP analysis still works.
Details:
- Client connects in cleartext (usually 25 / 587).
EHLO→ server advertisesSTARTTLS.- Client sends
STARTTLS→ server replies220 Ready to start TLS. - Both sides run a normal TLS handshake on that same TCP connection. ← packets dropped here; it is still a TCP session, so you can still see ACK, Seq, Flags.
- After TLS succeeds, both sides forget pre-TLS SMTP state; client must
EHLOagain over the encrypted channel.
So if the ServerHello / Certificate bytes never arrive contiguously on TCP, SMTP never gets a usable TLS session — and the app just looks “slow” or “stuck.”
The ClientHello in our traces used the common compatibility pattern:
Record version:      03 01  (TLS 1.0 at record layer)
Handshake version:   03 03  (TLS 1.2 inside ClientHello)
In Wireshark, the session showed TLS 1.0 — that really misled me. That does not mean “client only offered TLS 1.0.” The real problem was that the certificate chain never landed as a complete byte stream.
3. How cumulative ACK and SACK reveal the gap
TCP numbers every byte in a stream. The receiver tells the sender two things:
- Cumulative ACK — “I have all bytes before this number; send me this byte next.”
- Selective ACK(SACK) — “I also received this later range out of order.”
In this case, everything between the cumulative ACK and the SACK left edge is missing. Let’s visualize it: the client has already received server data up through byte N−1. After ClientHello it waits for byte N (start of the TLS ServerHello flight).
Server byte stream (sequence numbers):

  ... |████████████|░░░░░░░░░░░░|████|
      received OK   MISSING 2896   received
      ... N-1       N ... N+2895   N+2896 ... N+4095
                    ↑              ↑
              cumulative ACK       SACK left edge
              (= N)                (= N+2896)
Legend:
█— received and acknowledged in order░— never received (the hole)- trailing
█— received out of order (later segment arrived first)
How I analyzed it
Wireshark made the hole concrete. Packet 22 is a client ACK on port 25 with one SACK block:
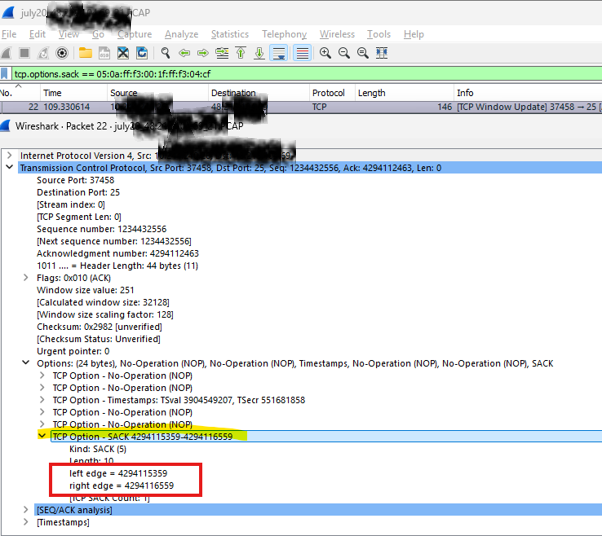
From that packet:
| Field | Value |
|---|---|
| Expected data | 4294112463–4294116559 |
| Cumulative ACK | 4294112463 |
| SACK block | 4294115359–4294116559 |
| Missing range | 4294112463–4294115358 |
4294115359 − 4294112463 = 2896 bytes missingThat hole alone needs at least two 1448-byte segments:
Expected segment 1: SEQ 4294112463, length 1448
Expected segment 2: SEQ 4294113911, length 1448
Observed next:      SEQ 4294115359   ← SACK left edge
A 1448-byte segment with DF=1 had basically no chance of getting through Akamai on this path. Akamai logs later confirmed the drops.
4. Vendor-specific MTU / MSS requirements
Tunneling (GRE, IPsec, etc.) eats header budget. Vendors often publish hard MSS ceilings so customer traffic still fits after encapsulation.
Akamai Prolexic Routed GRE requirements explicitly call out:
Support for TCP MSS adjustment: 1436 MSS (edge routers) and 1380 MSS (VPN concentrators)
Source: Akamai Services Descriptions (PDF)
TLS certificate messages are often the first “big” payload after the handshake starts, which is why it looked like a TLS problem.
Tools used
Analysis was done with:
- Python 3 + Scapy for flow grouping, seq/ack math, SACK/MSS parsing
- Wireshark-style fields for validation:
tcp.seq_raw,tcp.ack_raw,tcp.options.sack
Minimal Scapy pattern:
from scapy.all import rdpcap, IP, TCP

pkts = rdpcap("capture.pcap")
for i, p in enumerate(pkts, 1):
    if not p.haslayer(TCP):
        continue
    ip, t = p[IP], p[TCP]
    sacks = [v for k, v in t.options if k == "SAck"]
    print(i, f"{ip.src}:{t.sport} -> {ip.dst}:{t.dport}",
          f"seq={t.seq} ack={t.ack}", sacks)
The packet-loss conclusion came from that simple arithmetic:
missing = next_server_seq - client_cumulative_ackTakeaway
When TLS “fails to establish,” don’t stop at the TLS decoder. Check whether the TCP byte stream is complete first. Here, SACK plus identical sequence gaps across two capture points turned a vague “TLS problem” into a transport-layer evidence trail pointing at MTU-related drops and weak recovery on the failing SMTP path.
Reference
- Wireshark relative vs raw seq: https://wiki.wireshark.org/TCP_Relative_Sequence_Numbers
- SMTP STARTTLS: RFC 3207
- TCP SACK: RFC 2018
- Akamai GRE MSS (1436 / 1380): https://www.akamai.com/site/en/documents/corporate/akamai-services-descriptions.pdf